PPT1-Glied
Inhalt
PPT1-Glied
Lead–Glied (PD-T\(_1\) – Glied) und Lag–Glied (PP-T\(_1\) – Glied)
\[G(s) = V \frac{(1+T s)}{1+T\eta s}\]
Diagramme in Control
import control
import numpy as np
import matplotlib.pyplot as plt
plt.style.use('ggplot')
s = control.TransferFunction.s
V = 10
T = 1/2
n = 1/10
Gs = V*(1+T*s)/(1+T*n*s)
Gs
\[\frac{5 s + 10}{0.05 s + 1}\]
def check_proper_tf(Gs):
    """check if transferfunction is proper"""
    return len(Gs.num[0][0]) <= len(Gs.den[0][0])

check_proper_tf(Gs)
True
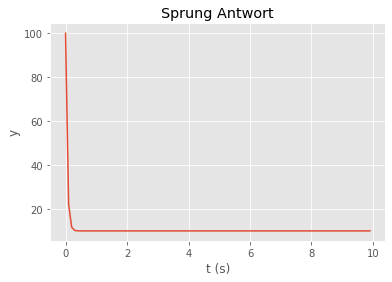
# step response
t = np.arange(0,10,0.1)
(tout, yout)  = control.step_response(Gs,t)
plt.plot(tout,yout)
plt.title("Sprung Antwort")
plt.ylabel("y")
plt.xlabel("t (s)")
Text(0.5, 0, 't (s)')
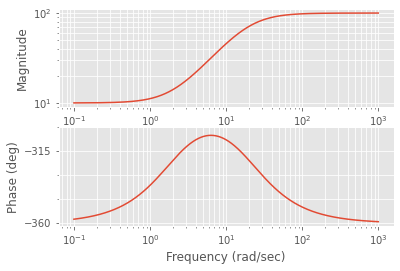
# bode diagram
(mag, phase_rad, w) = control.bode_plot(Gs)
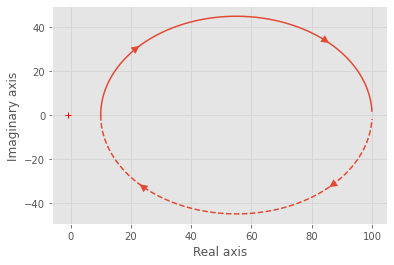
# nyquist plot
res_nyquist = control.nyquist_plot(Gs)
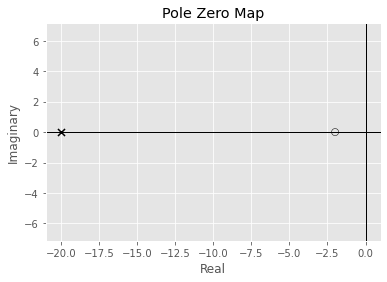
# pole zero map
poles, zeros = control.pzmap(Gs)