Matplotlib
Inhalt
Matplotlib
In Python gibt es eine Vielzahl von Plotting-Bibliotheken. Die wichtigste ist aber immer noch matplotlib welche von vielen anderen Bibliotheken verwendet wird. matplotlib hat einen weiten Funktionsumfang wie unter https://matplotlib.org/stable/gallery/index.html gezeigt wird.
import numpy as np

import matplotlib.pyplot as plt
plt.style.use('ggplot')
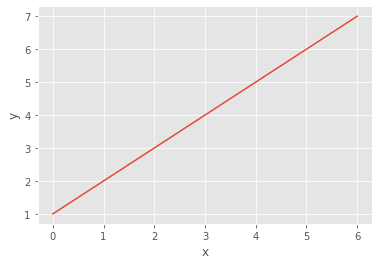
Basic Plot
Oft will man einfache Kurven plotten, was mit plot einfach zu erreichen ist.
x = np.array([0, 1, 2, 3, 4, 5, 6])
y = np.array([1, 2, 3, 4, 5, 6, 7])

plt.plot(x, y) # plot the data
plt.xlabel('x') # set the x-axis label
plt.ylabel('y') # set the y-axis label
plt.show() # shows the plot
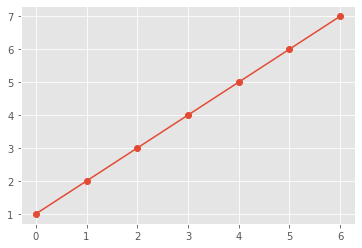
Wenn man die Datenpunkte extra hervorheben will,
stehen markers zur Verfügen, welche unter https://matplotlib.org/stable/api/markers_api.html#module-matplotlib.markers beschrieben sind.
plt.plot(x, y, marker='o')
plt.show()
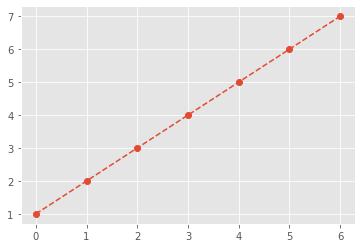
Auch die Darstellung der Linie kann mit linestyle verändert werden. Die verschiedenen Liniendarstellungen können unter
https://matplotlib.org/stable/gallery/lines_bars_and_markers/linestyles.html nachgelesen werden.
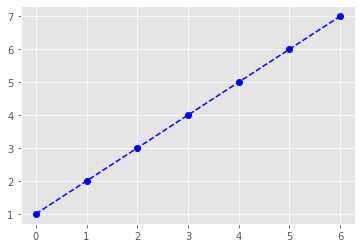
plt.plot(x, y, marker='o', linestyle='dashed')
plt.show()
Weiters kann auch die Plot-Farbe mit color verändert werden. Vordefinierte Namen für Farben können unter https://matplotlib.org/stable/gallery/color/named_colors.html nachgelesen werden.
import matplotlib.colors as mcolors
mcolors.BASE_COLORS
{'b': (0, 0, 1),
 'g': (0, 0.5, 0),
 'r': (1, 0, 0),
 'c': (0, 0.75, 0.75),
 'm': (0.75, 0, 0.75),
 'y': (0.75, 0.75, 0),
 'k': (0, 0, 0),
 'w': (1, 1, 1)}
plt.plot(x, y, marker='o', linestyle='dashed', color='blue')
plt.show()
Der gleiche Plot kann unter Verwendung eines Format String fmt = '[marker][line][color]' erzeugt werden.
plt.plot(x, y, 'o--b')
plt.show()

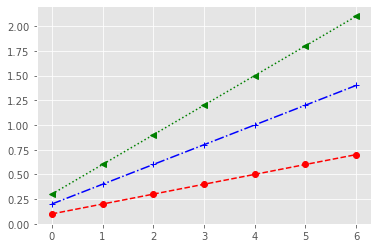
plt.plot(x, y*0.1, '--or')
plt.plot(x, y*0.2, '-.+b')
plt.plot(x, y*0.3, ':<g')
plt.show()
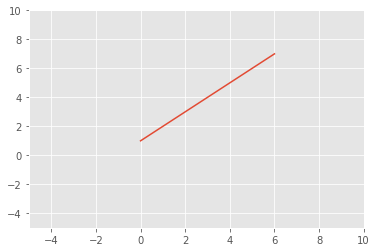
Mit xlim und ylim können die Dimension des Plots verändert werden.
plt.plot(x, y)
plt.xlim(-5,10)
plt.ylim(-5,10)
plt.show()
Labels und Beschriftungen
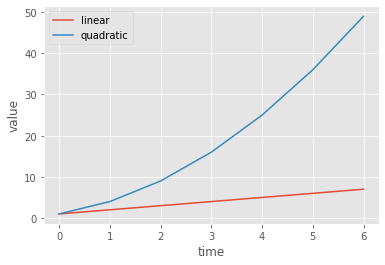
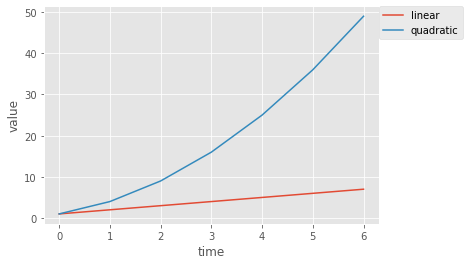
Das Hinzufügen von Legenden und Beschreibungen ist entscheiden für gute Diagramme. Mit ylabel und xlabel können Beschriftungen hinzugefügt werden.
plt.plot(x, y, label='linear')
plt.plot(x, y**2, label='quadratic')
plt.legend()
plt.ylabel('value')
plt.xlabel('time')
plt.show()
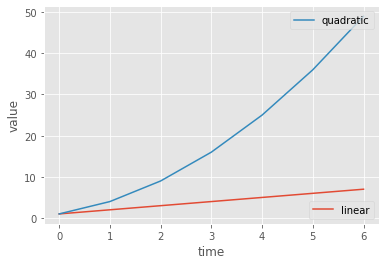
plt.plot(x, y, label='linear')
plt.plot(x, y**2, label='quadratic')
plt.legend(bbox_to_anchor=(1, 1), loc='upper left', borderaxespad=0.)
plt.ylabel('value')
plt.xlabel('time')
plt.show()
line1, = plt.plot(x, y, label='linear')
line2, = plt.plot(x, y**2, label='quadratic')
first_legend = plt.legend(handles=[line2], loc='upper right')
ax = plt.gca().add_artist(first_legend)
plt.legend(handles=[line1], loc='lower right')
plt.ylabel('value')
plt.xlabel('time')
plt.show()
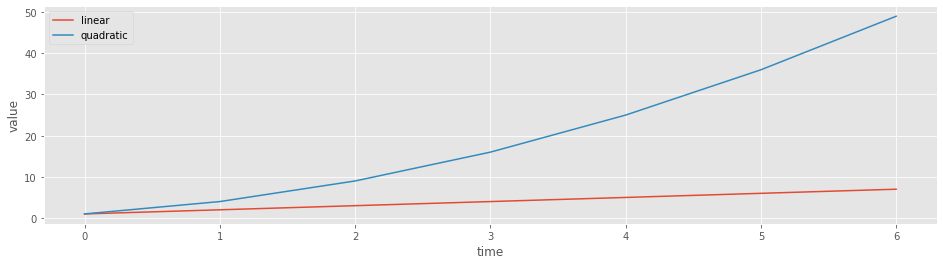
plt.figure(figsize=(16,4))
plt.plot(x, y, label='linear')
plt.plot(x, y**2, label='quadratic')
plt.legend()
plt.ylabel('value')
plt.xlabel('time')
plt.show()
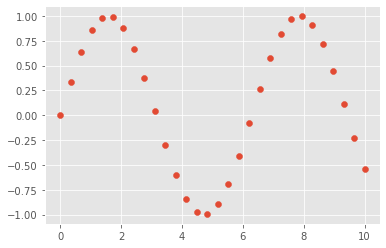
Scatterplot
import matplotlib.cm as cm
x = np.linspace(0, 10, 30)
y1 = np.sin(x)
plt.scatter(x, y1)
plt.show()
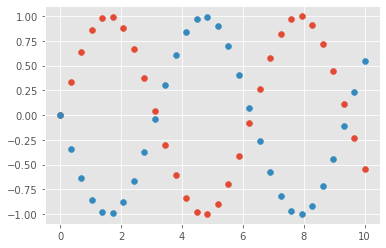
y2 = -y1
plt.scatter(x, y1)
plt.scatter(x, y2)
plt.show()
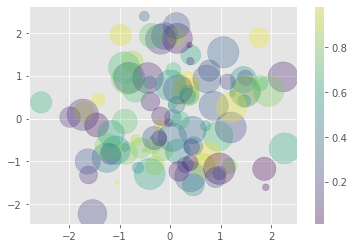
rng = np.random.RandomState(0)
x = rng.randn(100)
y = rng.randn(100)
colors = rng.rand(100)
sizes = 1000 * rng.rand(100)

plt.scatter(x, y, c=colors, s=sizes, alpha=0.3,
            cmap='viridis')
plt.colorbar();  # show color scale
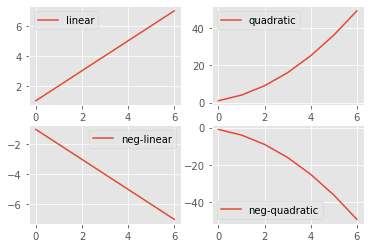
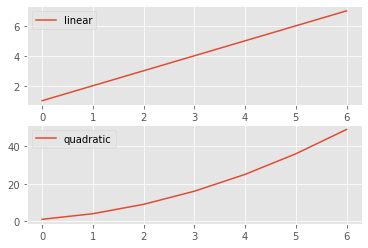
Subplots
plt.subplot(2,1,1)
plt.plot(x, y, label='linear')
plt.legend()
plt.subplot(2,1,2)
plt.plot(x, y**2, label='quadratic')
plt.legend()
plt.show()
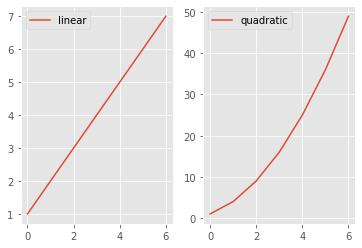
plt.subplot(1,2,1)
plt.plot(x, y, label='linear')
plt.legend()
plt.subplot(1,2,2)
plt.plot(x, y**2, label='quadratic')
plt.legend()
plt.show()
plt.subplot(2,2,1)
plt.plot(x, y, label='linear')
plt.legend()
plt.subplot(2,2,2)
plt.plot(x, y**2, label='quadratic')
plt.legend()
plt.subplot(2,2,3)
plt.plot(x, -y, label='neg-linear')
plt.legend()
plt.subplot(2,2,4)
plt.plot(x, -y**2, label='neg-quadratic')
plt.legend()
plt.show()